 Unjuiced
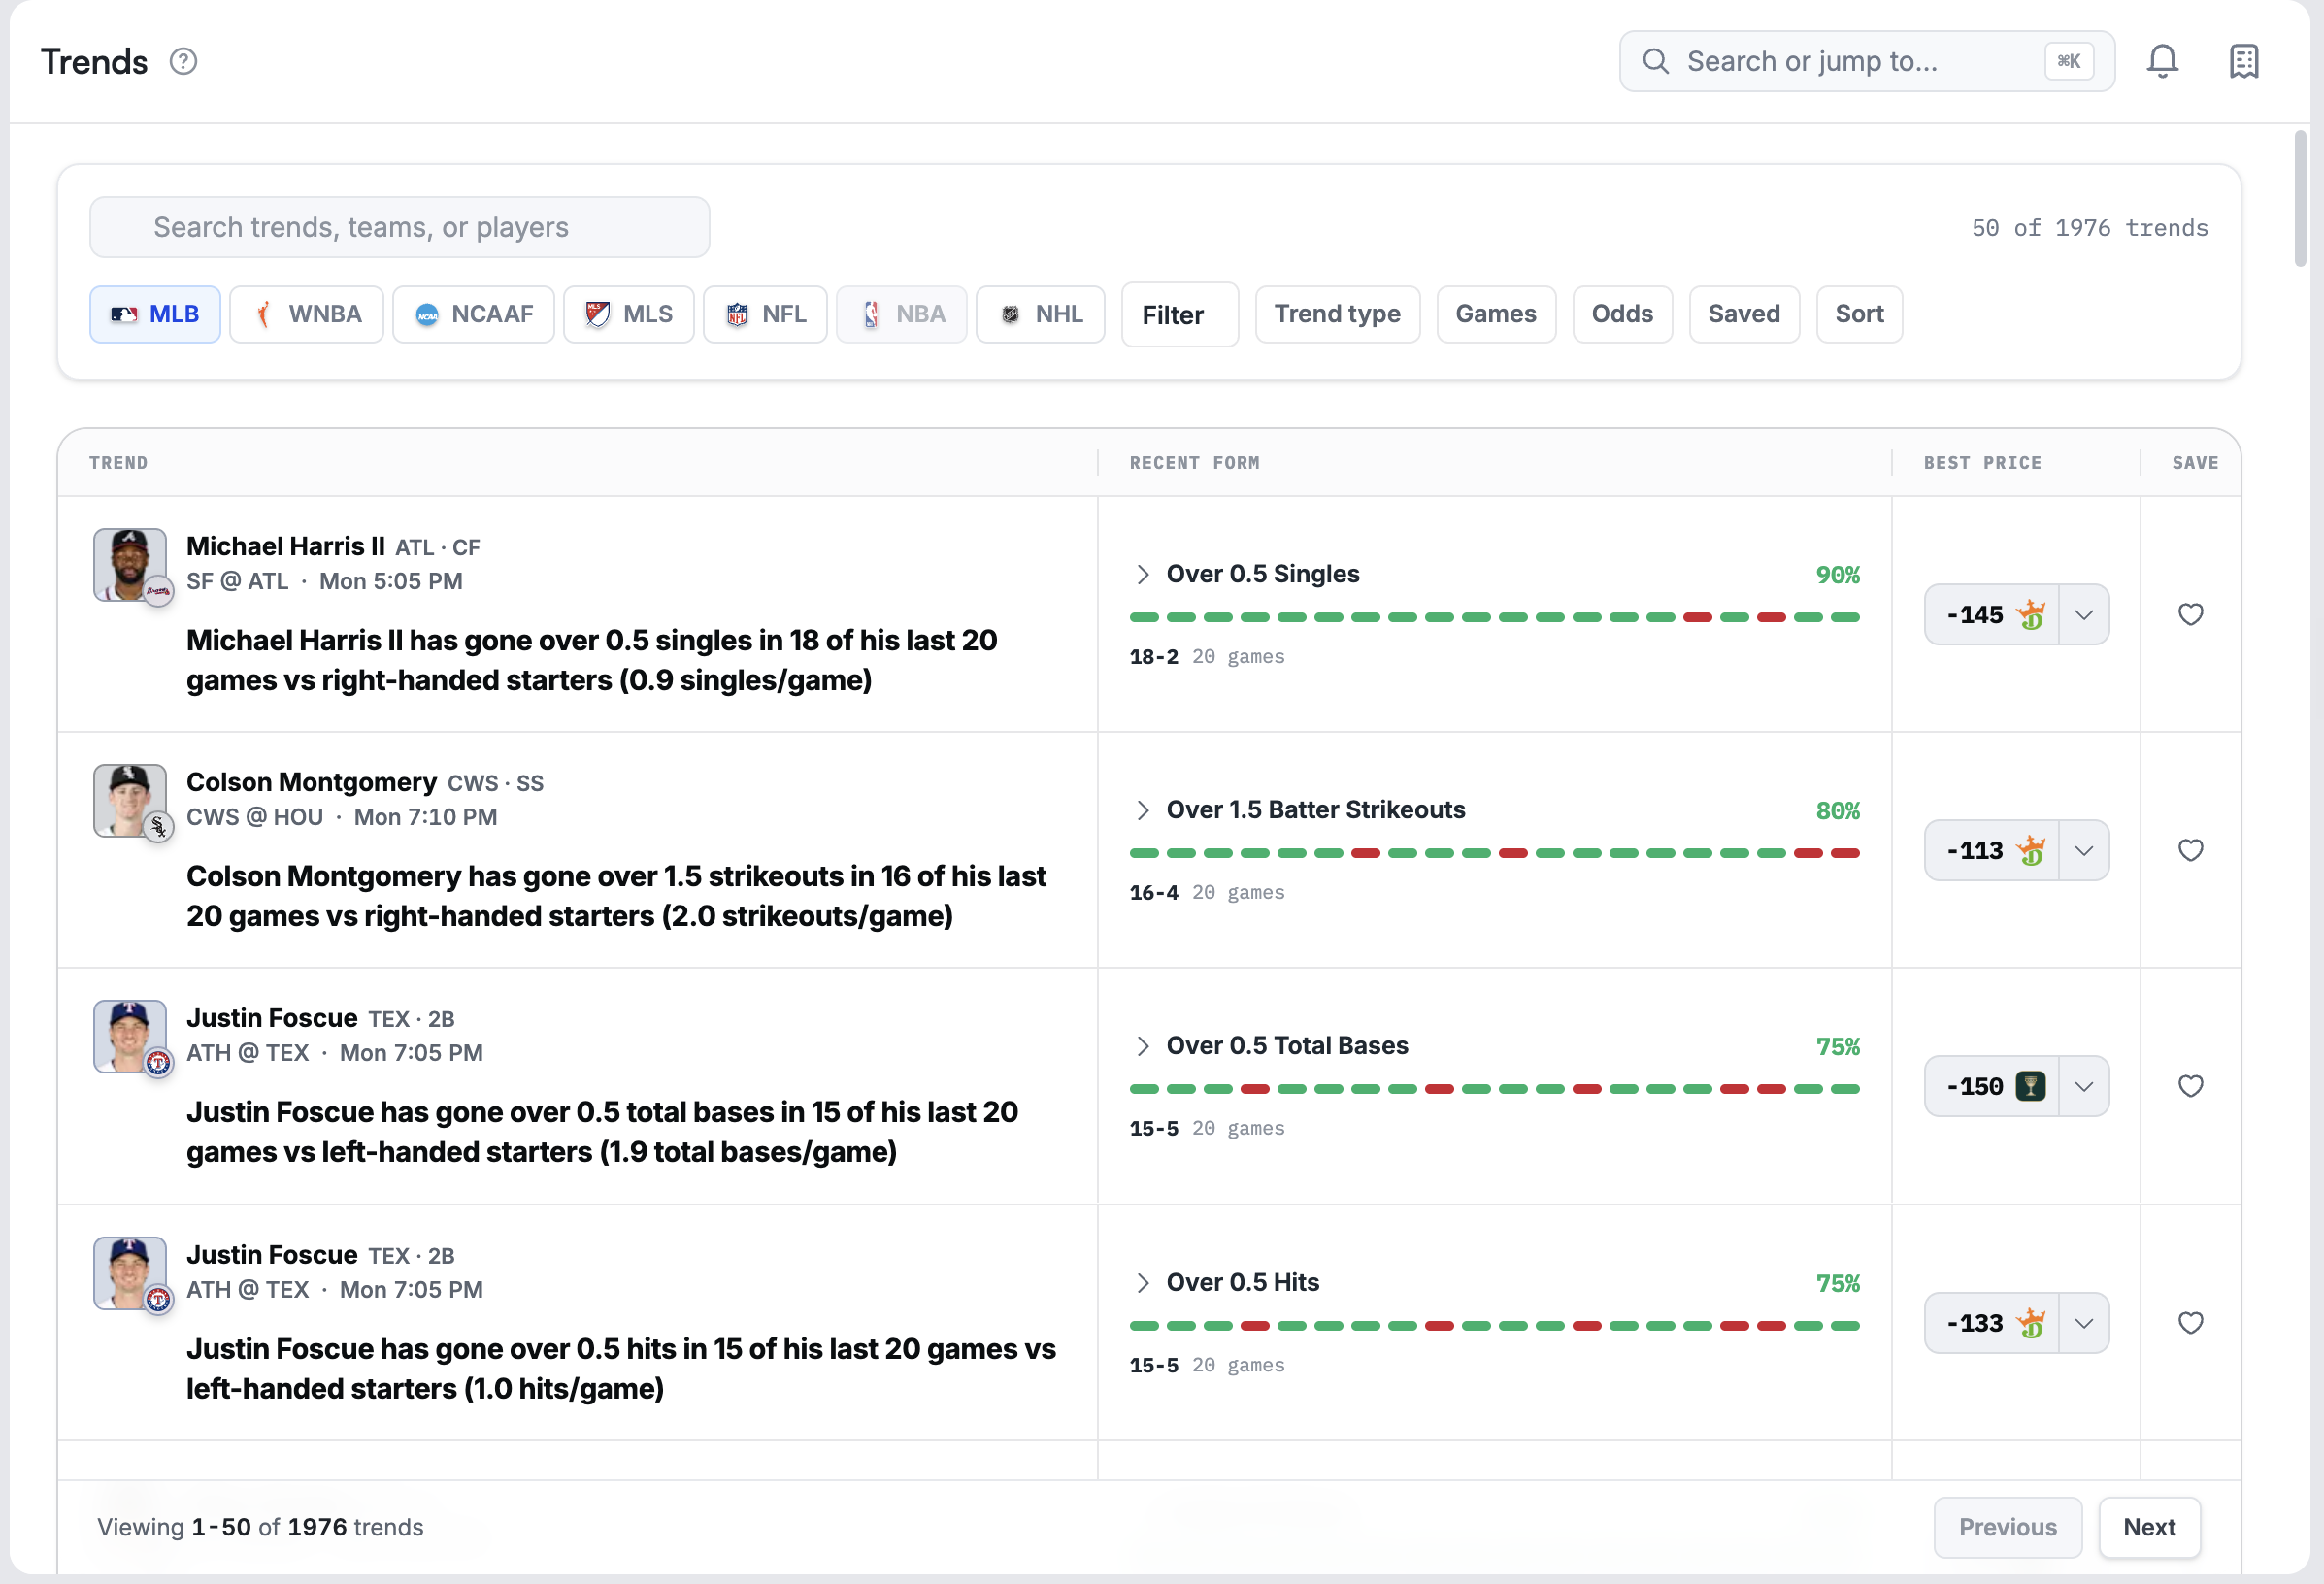
Trends starts with a historical pattern and connects it to an event or market. Read the claim, its sample, and the current price together. A repeated pattern is useful research context; it is not itself a forecast.
Start with one trend
- Choose the sport and available filters for the research you want to inspect.
- Read the subject, stat, side, and threshold. Check whether it concerns a player, a team, or a game.
- Read how many games support the claim and the time window they cover.
- Open the trend to inspect its evidence and matchup research.
- Compare the current line and quote with the historical condition.
- Save the research and add a note if you want to revisit it before the event.
Compare the research windows
The matchup research view offers windows such as This trend, Last 5, Last 10, Head-to-head, and Season where supported.
- This trend isolates the games supporting the particular claim.
- Last 5 / Last 10 put that claim beside recent overall form.
- Head-to-head narrows to the opponent matchup; check the resulting sample count.
- Season adds longer context when available.
These windows answer different questions. A tiny head-to-head sample should not be treated as equally informative as a larger sample simply because its percentage is higher.
Read the evidence
Look at the individual observations, not just the success count. Check whether recent role, playing time, usage, opponent, or conditions differ from the historical sample. Sport-specific research can show relevant measures such as minutes, shot attempts, snaps, targets, carries, or pitching context where supported.
A dash or unavailable chart point is missing data. It is not a zero-valued performance. Odds history and research timestamps also matter: a trend can remain historically true after its associated price changes.
Worked example
A player cleared 19.5 points in eight of the last ten games. That statement describes those ten results. If today's line is 22.5, the headline does not establish an 80% rate against today's threshold. Open the log, compare the correct line, and check whether the player's expected role has changed.
Likewise, a streak of team totals going Over does not explain why it happened. Inspect the relevant games and context before assuming the same conditions persist.
Save and revisit research
Use the save control to keep an item in the research watchlist. The saved view includes a snapshot, saved evidence, changes since saving, and notes where available. Search saved research by player, team, or note text.
Write a note that names the question you still need to answer, such as “Check starting lineup and compare the current line before first pitch.” When you return, compare the saved snapshot with the current state. A saved quote is not a reserved price.
Trends and Hit Rates
Hit Rates starts from a player prop and measures its history. Trends starts from a pattern and lets you investigate its connection to an upcoming market. They are complementary, but two screens showing the same underlying games are not independent evidence.
Troubleshooting
- Few or no trends: check the selected sport and filters; qualifying research varies with the slate and available history.
- A price is missing: the research can exist without a current supported quote.
- A saved item changed: compare the snapshot and current evidence; new games, lines, or quotes can change the context.
- A drilldown lacks a panel: evidence coverage differs by sport and market.