 Unjuiced
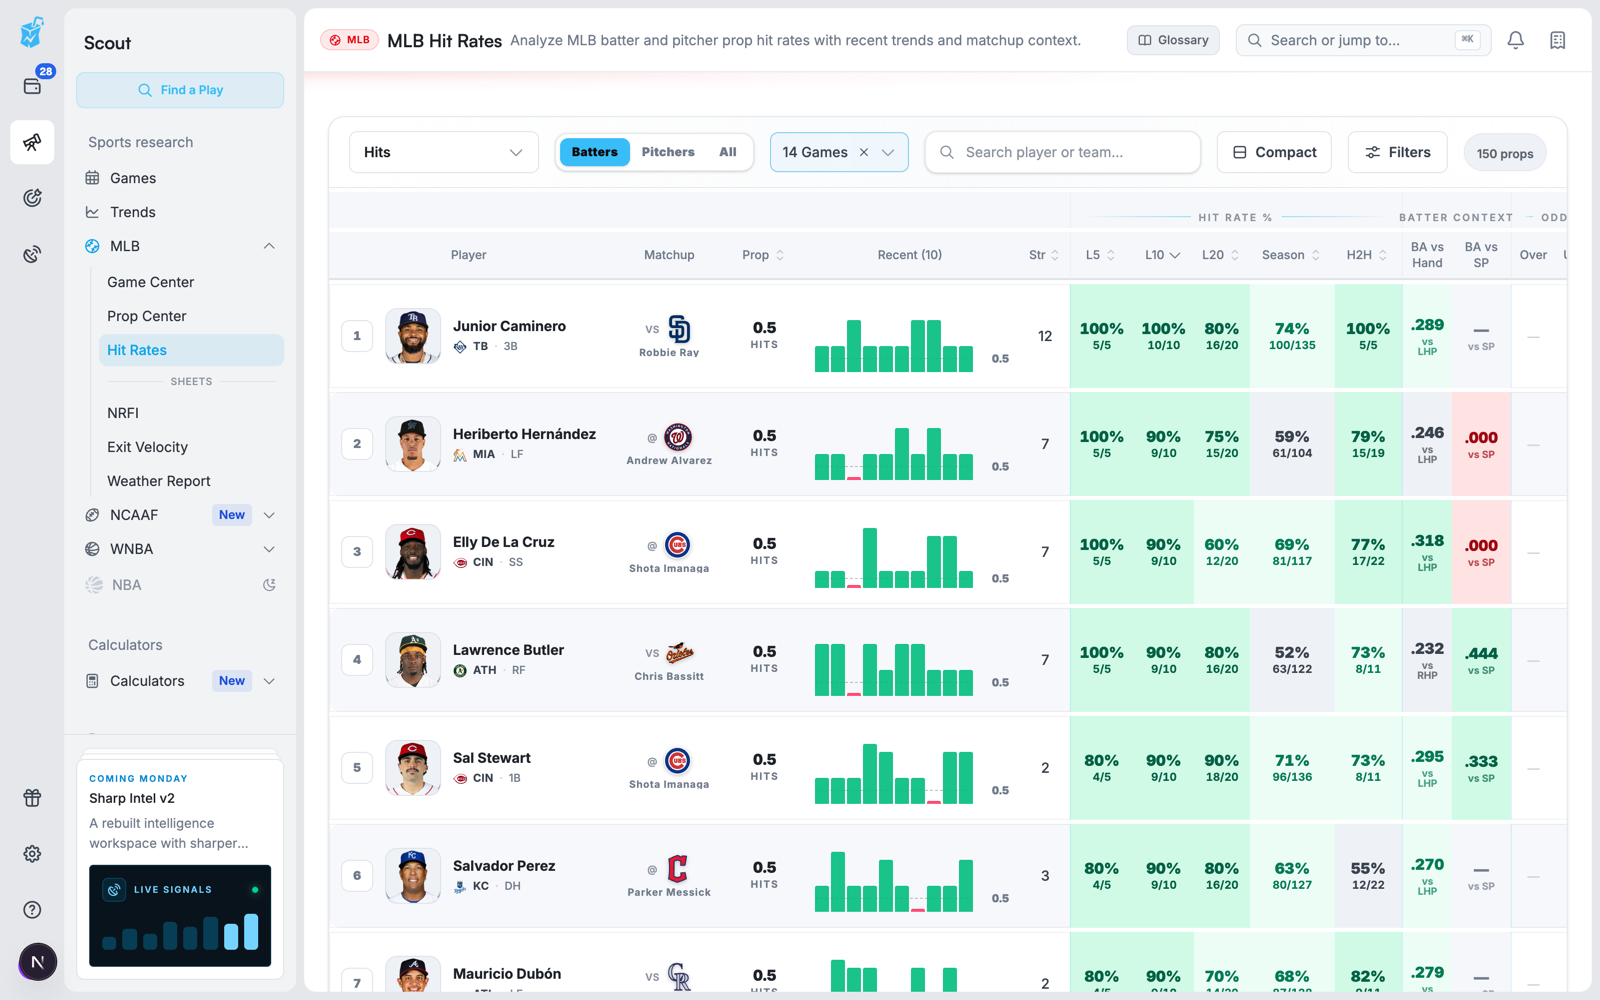
Hit Rates starts with a player, stat, and threshold, then shows how often the available historical games cleared that threshold. Use it to identify questions for further research—not to substitute a past percentage for today's probability.
Set up a research pass
- Select your sport and stat/market.
- Check the selected slate or date and search for a player or team if you have one in mind.
- Where available, use the history/sample filter to distinguish established records from short samples.
- Sort by Best L10, Best L5, Best season, or Most history. Some league boards also offer score or grade sorting.
- Open the player's row or View player page action to inspect the underlying games.
- Compare the exact current line and price after reviewing the context.
Read the row
| Metric | What to check |
|---|---|
| Line | The exact threshold used for this prop |
| L5 / L10 / L20 | Last 5, 10, or 20 available games in the displayed sample |
| Season | The broader season sample when available |
| Hit rate | Fraction of the displayed sample satisfying the line/side definition |
| Average | Mean stat production; large outliers can move it |
| Score / grade | A league-specific research ranking, not a win percentage |
| Sample count | How many observations support the displayed result |
Where a score can expand, open its breakdown rather than treating the headline as a complete explanation. A missing value means data is unavailable; it should not be interpreted as a failed performance.
Worked example: same player, different line
Suppose a player recorded 3, 6, 4, 7, and 5 in five games. Against Over 4.5, three games hit: 60%. Against Over 5.5, two hit: 40%. The average is 5.0 in both cases.
This is why the line matters as much as the player. Neither percentage establishes the probability for the next game, and comparing only averages hides how the outcomes are distributed.
Inspect the player details
Start with the game log. Look for sustained production versus a few large games, and note how many games actually contribute to the sample. Compare recent and longer windows before drawing a conclusion.
Then inspect the available matchup, roster, injury, or usage context. The relevant questions depend on the sport: minutes and shot attempts in basketball; snaps, targets, and carries in football; lineup position and pitcher matchup in baseball. Not every league exposes every panel.
A role change can make the old sample less representative. For players who changed teams, check whether the available history reflects the current role rather than assuming all games describe the same opportunity.
Compare alternate thresholds
A lower Over line may have a higher historical hit rate but a lower payout. That trade-off needs a price comparison, not just a green percentage. Use available alternates or the Hit Rate Matrix to compare thresholds, then verify the exact offer on the Odds Screen.
Saving a selection adds a research item; it does not lock the line or place the bet. See My Slips for organizing saved plays.
Troubleshooting
- A player is missing: check league, market, search text, sample filters, slate coverage, and whether a current prop exists.
- Two windows show different rates: their samples differ; open the log rather than choosing only the most favorable one.
- An average looks strong but the rate is weak: outliers can raise the mean without many games clearing the threshold.
- A detail panel is unavailable: league coverage or your account access may differ from the board preview.
- No current price: historical research can exist without an executable offer.