
Open Deployment radar. In hockey, deployment means how a coach uses a player: which line they're on, whether they're on the first power-play unit (PP1), and how many minutes they play. When deployment changes, a player's shots and points change with it, often before a 10-game average shows it. The radar lists every notable change on tonight's slate.
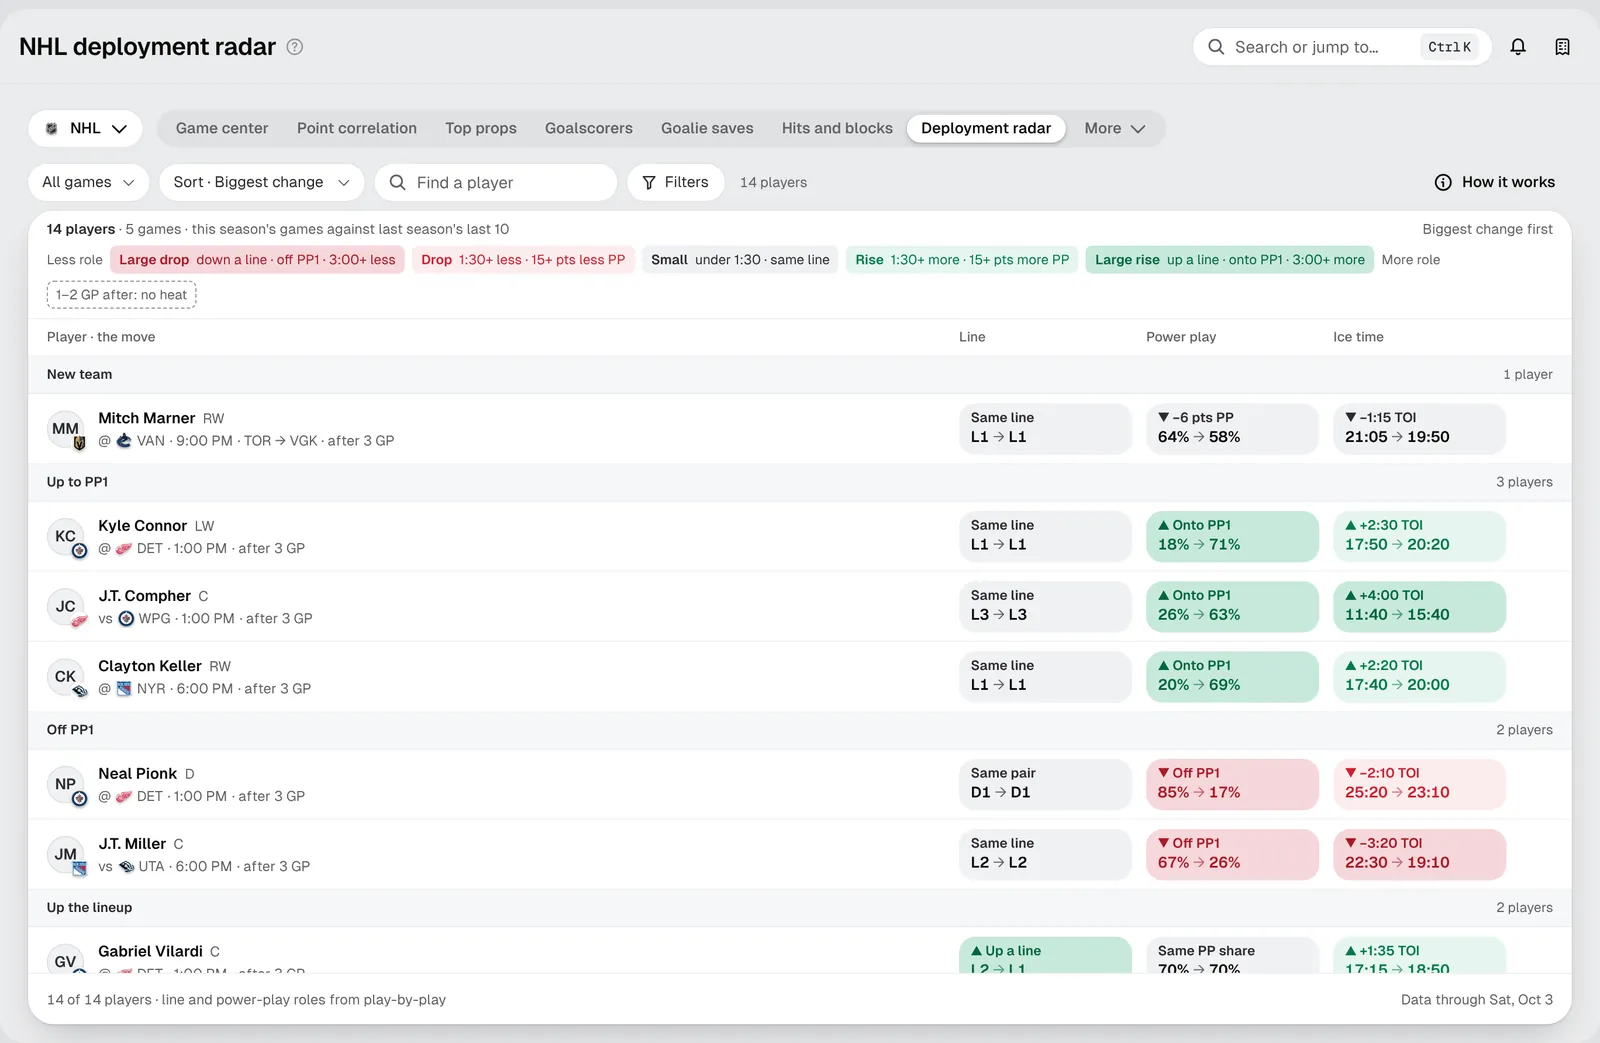
Reading a row
Each player sits under the biggest kind of change they had: New team, Up to PP1, Off PP1, Up the lineup, Down the lineup, More ice time or Less ice time.
The row then has three tiles, each before → after:
- Line: for example L2 → L1, moved up from the second line to the first. Defensemen show pairs (D1, D2).
- Power play: the share of the team's power-play time the player gets. 18% → 71% means they've moved onto the first unit.
- Ice time: average minutes a game. +2:30 TOI 17:50 → 20:20 means two and a half more minutes a night.
"Before" is the player's last 10 games in the old role. "After" is the latest games in the new one (up to 3), and the row says how many, for example after 3 GP. Early in the season, "before" is last season's last 10.
The colors
Green means more role, red means less. The legend at the top of the list explains the sizes:
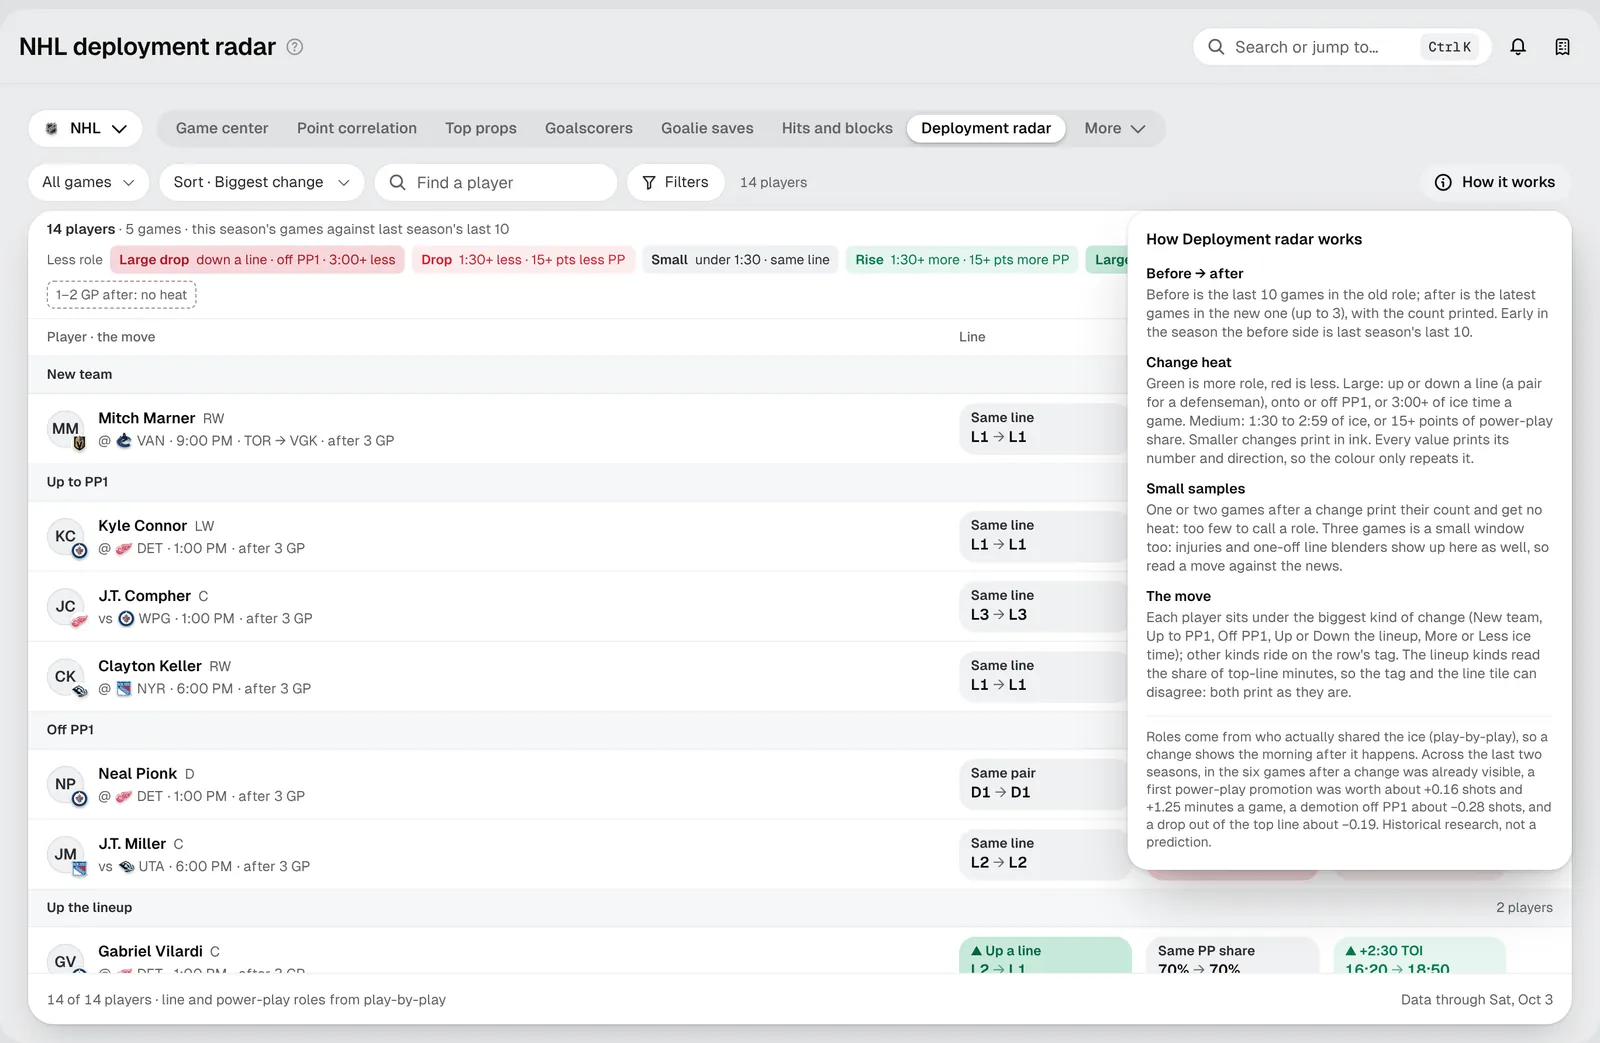
- Large: up or down a line, onto or off PP1, or 3:00+ of ice time a game.
- Medium: 1:30 to 2:59 of ice time, or 15+ points of power-play share.
- Small: smaller changes print in plain ink.
With only one or two games after a change, the tiles print their count and have no color. That's too few to call it a new role.
Your first five minutes
- Pick a game. All games narrows the list to tonight's matchups you care about.
- Sort. Biggest change puts the largest moves first. Puck drop orders by game time.
- Read the groups. Start with Up to PP1 and Up the lineup: those players have the most new opportunity.
- Open a player. Click a row for the game-by-game detail before and after, and the shots and attempts that went with it.
Tips for newer bettors
- Promotions lead, results follow. A player bumped onto PP1 three games ago may still have a low shots line. That gap is what the radar is for.
- Read it against the news. Three games is a small window. An injury to a teammate or a coach "blending the lines" for one game shows up here too. Check why a player moved.
- Pair it with Injury impact. A promotion often happens because someone is out. Injury impact shows who gains from each absence.
Troubleshooting
- A player I expected isn't listed: only notable changes appear, and only for players on tonight's slate.
- The line tile and the group disagree: the lineup groups read the share of top-line minutes, while the tile shows the line itself, so the two can differ. Both are shown as they are.