
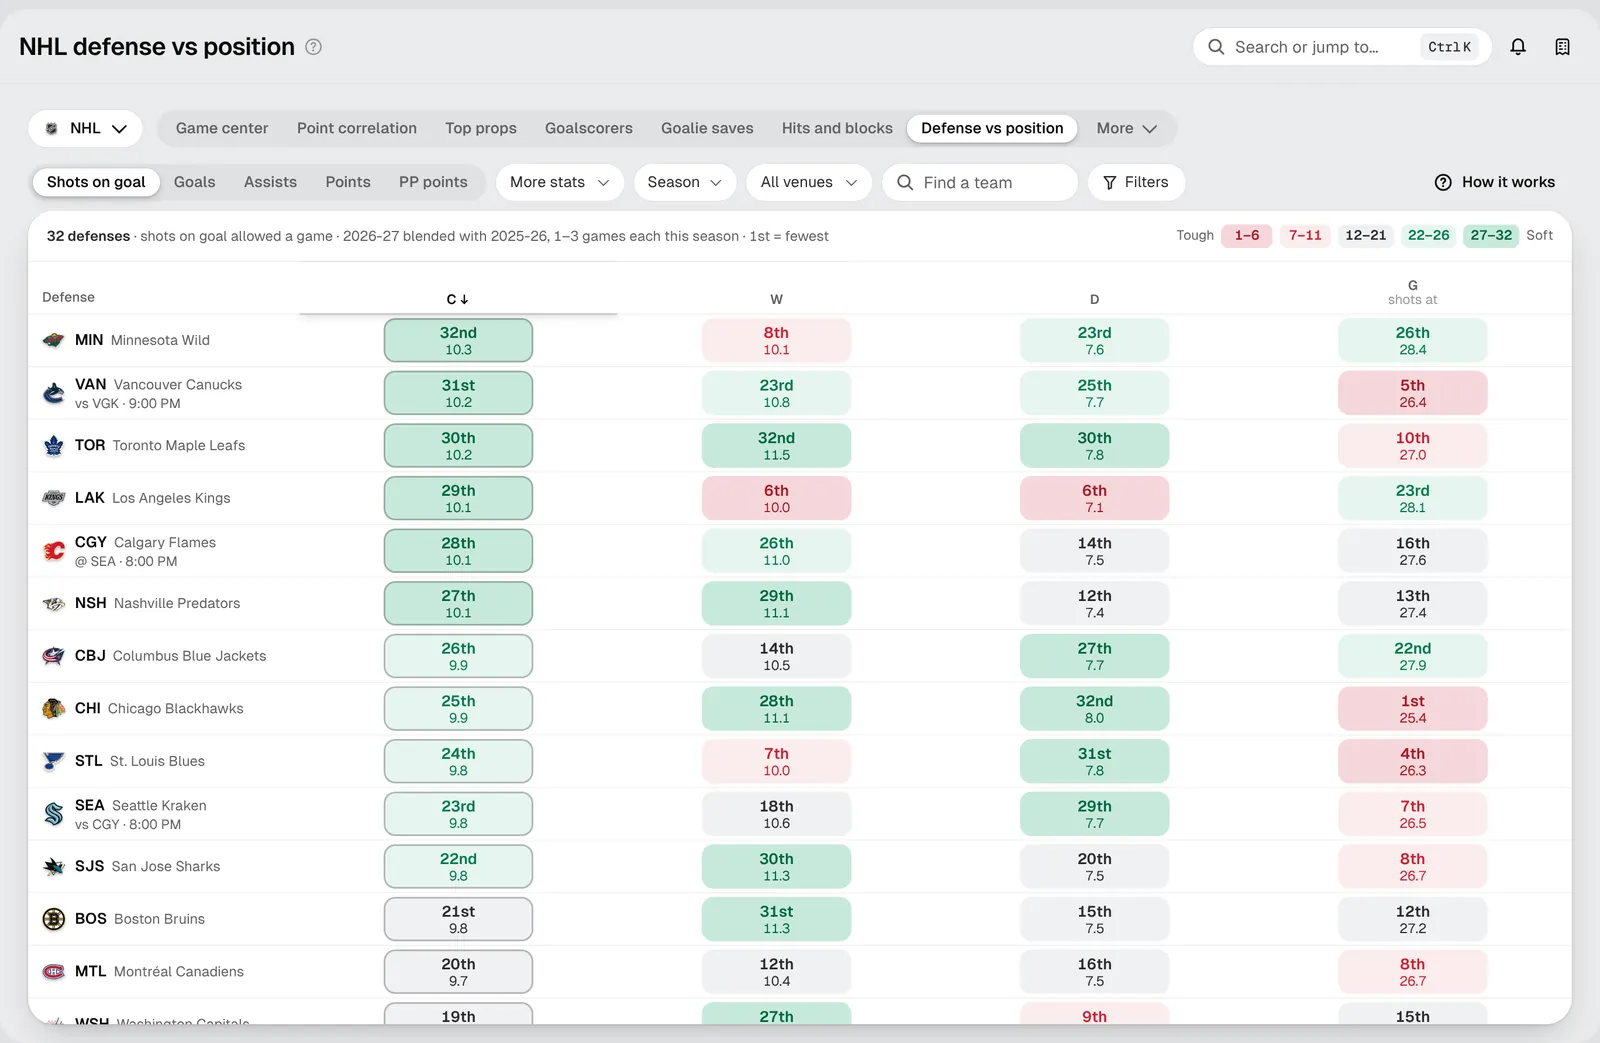
Open NHL Defense vs position. Every team defends some players better than others. This matrix shows, for all 32 defenses, how much they allow to each position group. Use it as context: a winger facing a defense that gives up lots of shots to wingers has a friendlier night.
Reading the matrix
- Rows are defenses. Teams playing tonight show their game under the name.
- C, W and D are centers, wingers and defensemen, by listed position.
- G (shots at) is different: it's what the team's own offense puts on the goalie it faces. A high rank there means the goalie facing them will have more saves to make.
- Each cell shows a rank on top and the average allowed a game underneath. 32nd · 10.3 means 10.3 shots on goal a game to centers, the most in the league.
1st allows the fewest (tough). 32nd allows the most (soft). The legend in the top right runs from red (1–6) through gray (12–21) to green (27–32).
Your first five minutes
- Pick the stat. Shots on goal is the default. Goals, Assists, Points, PP points and More stats cover the rest.
- Pick the window. Season blends this season with last until there are enough games. Last 20, 10 or 5 shows recent form.
- Pick the venue. All venues, or only the defense's home or road games.
- Sort. Click a column header to rank the defenses by it.
- Open a cell. It shows the games behind the number, where that defense allows shots, and tonight's opposing skaters in that group. Click a team name (or a G cell) for every stat, its rink, and last 10 against the season.
Which split to trust
Some splits hold up over a season better than others:
- Forwards vs defensemen and by ice-time role carry over well from one half of a season to the next.
- Centers vs wingers doesn't carry over much. Read C and W together, or switch the grouping in Filters.
In Filters, Group skaters by switches the columns to Forwards · Defense, or to Role: the top line, the middle six, the bottom six, the top pair and the other defensemen, by ice time in each game. Role is often the more useful view, because a first-line winger and a fourth-line winger are very different matchups.
Tips for newer bettors
- Context, not a projection. A soft cell is a lean. Pair it with the player's own shots, ice time and line.
- Early-season numbers move. The header prints how many games are behind each number. With 1–3 games a team this season, the blend with last season does most of the work.
- Goalie saves: use the G column. A team that shoots a lot gives the opposing goalie more saves.
Troubleshooting
- The numbers look like last season's: early on, Season blends both seasons until this season has enough games.
- A team is missing: clear the search, and check Teams in Filters is set to All 32, not Tonight's teams.